
AI Visibility Measurement Needs Confidence Intervals
Key Takeaways
- One AI search test cannot show a brand’s true visibility.
- The study analyzed more than 753,000 citations across three platforms.
- Citation sources changed when researchers repeated the same queries.
- Small visibility gains may be normal measurement noise.
- Reliable reports need repeated tests and confidence intervals.
AI visibility measurement should not rely on one batch of search results. A 2026 study found that citation shares and rankings changed across repeated runs. This happened even when researchers used the same queries and mostly stable source pages.
The findings challenge a common practice in generative engine optimization. Many tools show citation share as a fixed score. However, the study argues that this score is only an estimate from a noisy sample.
As a result, marketers should report a range of likely values. They should not treat one number as the final truth.
What Is AI Visibility Measurement?
AI visibility measurement tracks how often a website appears in answers from generative search platforms. Common metrics include citation count, citation share, and citation prevalence.
These metrics help brands study their presence in tools such as Gemini, Perplexity, and AI-powered search systems. However, each answer engine can return different sources when the same query runs again.
Therefore, AI citation tracking is a probability problem. It is not a fixed ranking system.
What the Research Studied?
The paper, titled Quantifying Uncertainty in AI Visibility, was written by Ronald Sielinski. Its second version appeared on arXiv in June 2026.
The study examined three generative search platforms:
- Google Gemini
- OpenAI SearchGPT, as named in the paper
- Perplexity Search
Researchers tested three consumer topics:
- Bird feeders
- Multivitamins for adults
- Running gear
They created 200 queries for each topic. The query sets included 172 unique bird feeder queries, 152 unique multivitamin queries, and 185 unique running gear queries.
The researchers then used two sampling methods.
| Study element | Reported design |
|---|---|
| Platforms | Three generative search platforms |
| Topics | Three consumer product topics |
| Queries | 200 queries per topic |
| Daily testing | Once daily for nine days |
| Rapid testing | Ten-minute intervals over about four hours |
| Rapid samples | 25 collections per platform, as reported in the methods |
| Daily citations | 374,052 |
| High-frequency citations | 379,276 |
| Total extracted citations | 753,328 |
The daily study produced about 200 responses for each platform and topic during each collection. However, some requests did not return usable responses.
Why One AI Search Test Can Be Misleading
Generative search engines do not always create the same answer twice. Their retrieval and generation systems can select different pages during each run.
The paper separates this problem into two parts.
System-Level Stochasticity
System-level stochasticity means the answer engine itself can change its output. The same question may produce a new answer or a different group of citations.
This variation can come from language generation or document retrieval. It remains present even when the query does not change.
Measurement Uncertainty
Measurement uncertainty comes from using a limited sample.
For example, a report based on 200 responses may not match the platform’s long-term citation pattern. A different set of 200 responses could produce another result.
Both forms of uncertainty affect AI visibility measurement. Therefore, a single score can look more precise than it really is.
The Three Main AI Visibility Metrics
The paper studies three common GEO metrics.
| Metric | What it measures | Main limitation |
|---|---|---|
| Citation count | Total citations received by a domain | Changes with sample size and platform citation volume |
| Citation share | Domain citations divided by all citations | Can move across repeated samples |
| Citation prevalence | Share of responses that cite the domain | Does not measure repeated citations within one answer |
Citation count is easy to understand. However, it is hard to compare across platforms.
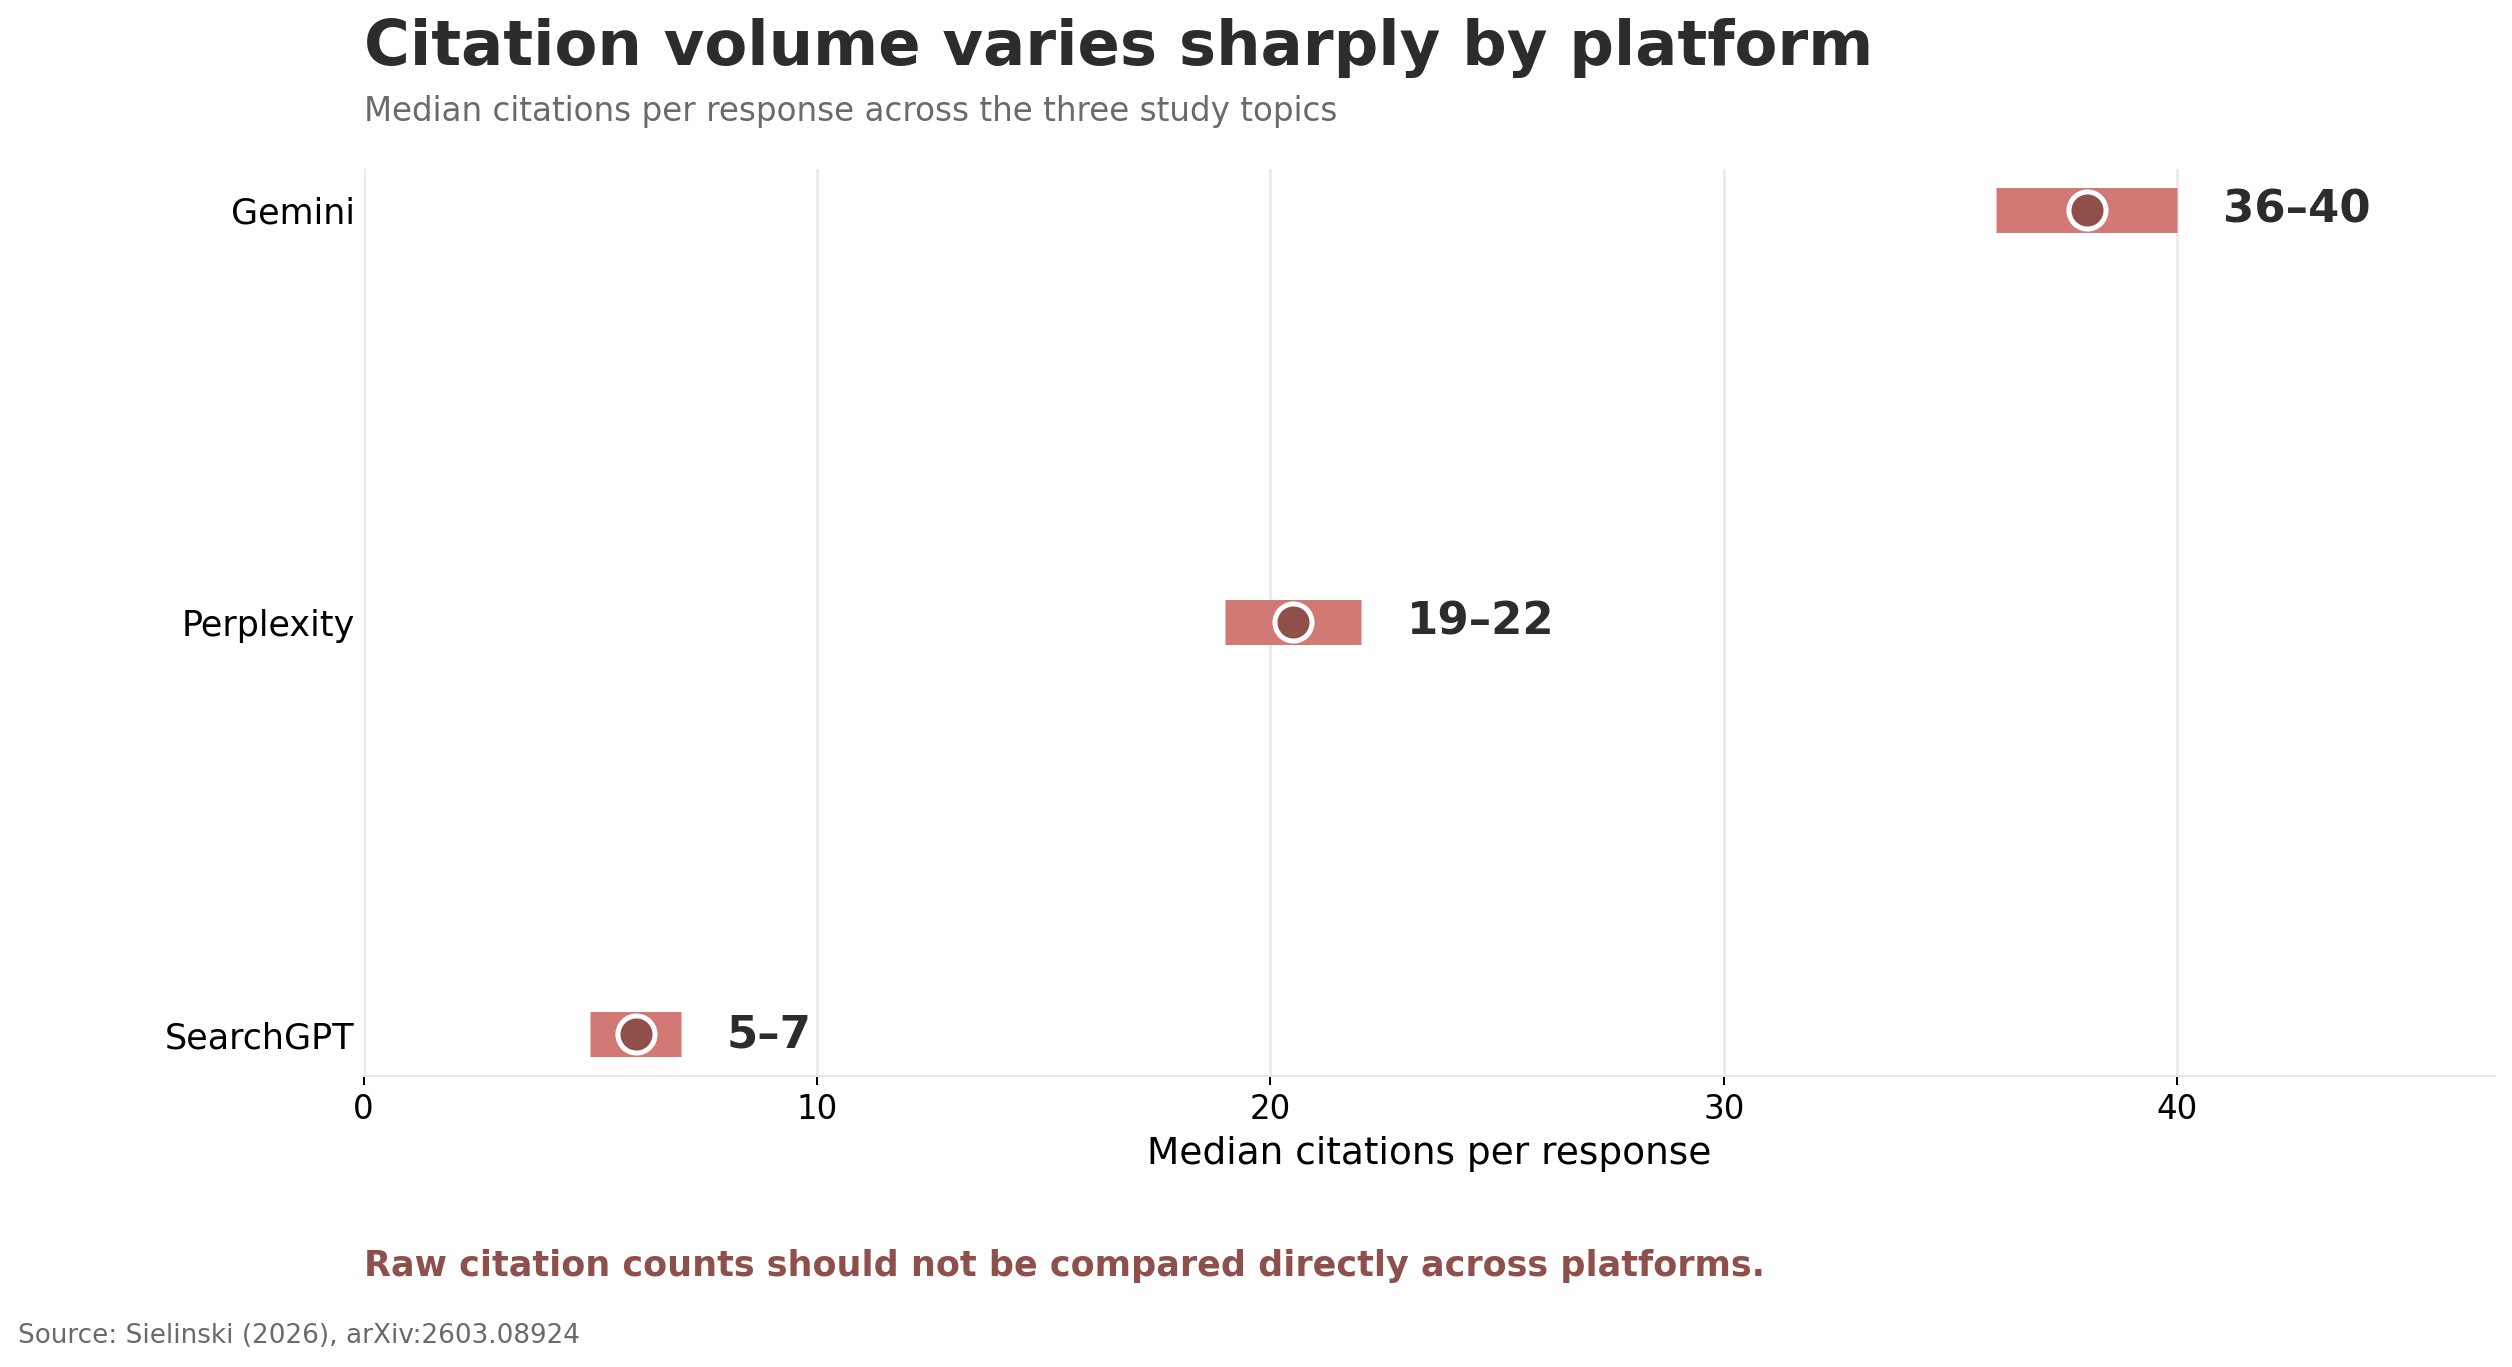
For example, the platforms produced very different numbers of citations per response. Gemini returned about 40 to 43 citations. Perplexity returned about 20 to 22. SearchGPT returned about six to seven.
Citation share offers a better cross-platform measure. Still, it must be treated as an estimate rather than a permanent score.
The Same Query Often Produced Different Sources
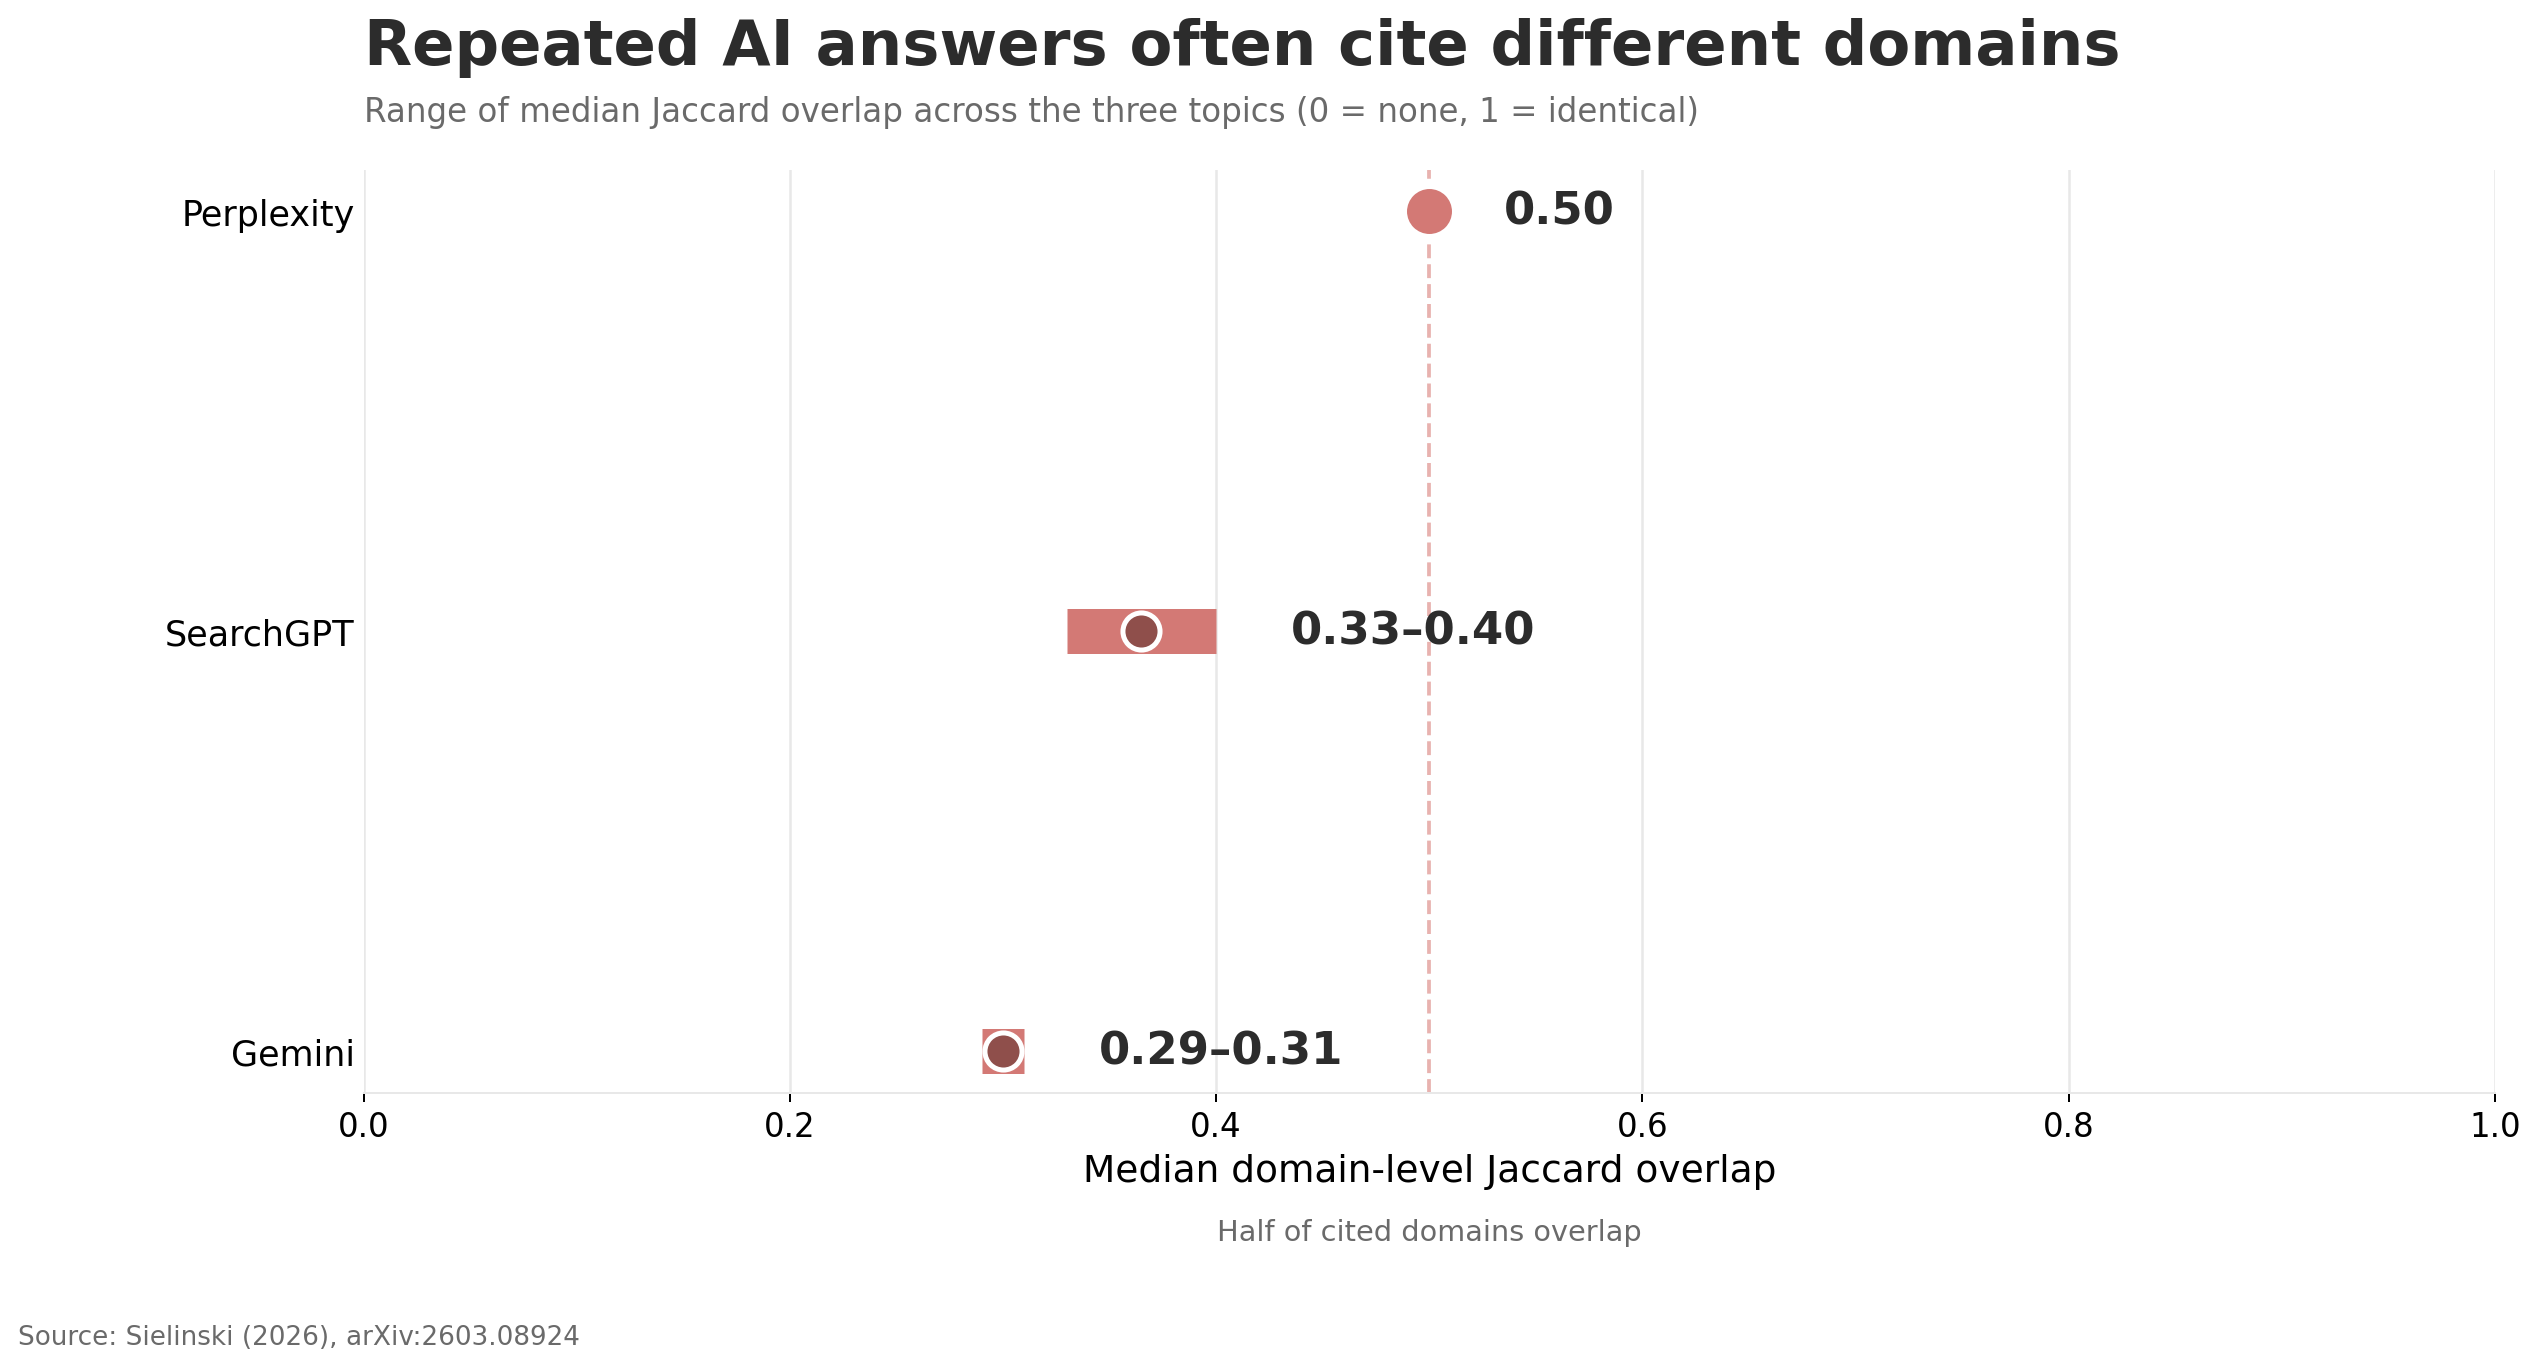
Researchers compared the citation domains returned for the same query across repeated runs.
They used the Jaccard index. A score of 1 means the two answers cited the same set of domains. A score of 0 means they shared no cited domains.
Median scores ranged from:
- 0.29 to 0.31 for Gemini
- 0.33 to 0.40 for SearchGPT
- 0.50 for Perplexity
In simple terms, even the most consistent platform shared only about half of its citation domains between typical repeated answers.
Fully identical citation sets were also rare. Gemini’s identical rate ranged from 0.01% to 0.10%. SearchGPT and Perplexity reached roughly 3% to 8%, depending on the topic.
SearchGPT also produced zero shared citation domains in about 6% to 9% of paired answers. Perplexity’s zero-overlap rate was lower, at about 1% to 2%.
These results show why one test should not become a permanent AI search ranking.
AI Citations Followed a Power-Law Pattern
The citation distributions followed a power-law shape across all nine platform and topic combinations.
A power-law pattern means a small group of domains collects a large share of citations. Many other domains receive very few.
This creates a long tail:
- A few sites appear often.
- A larger group appears sometimes.
- Many sites appear once or disappear in later samples.
The broad shape stayed similar across repeated tests. However, individual domains moved within that shape.
Therefore, a stable overall pattern does not mean each website has a stable citation share.
Confidence Intervals Turn Rankings Into Ranges
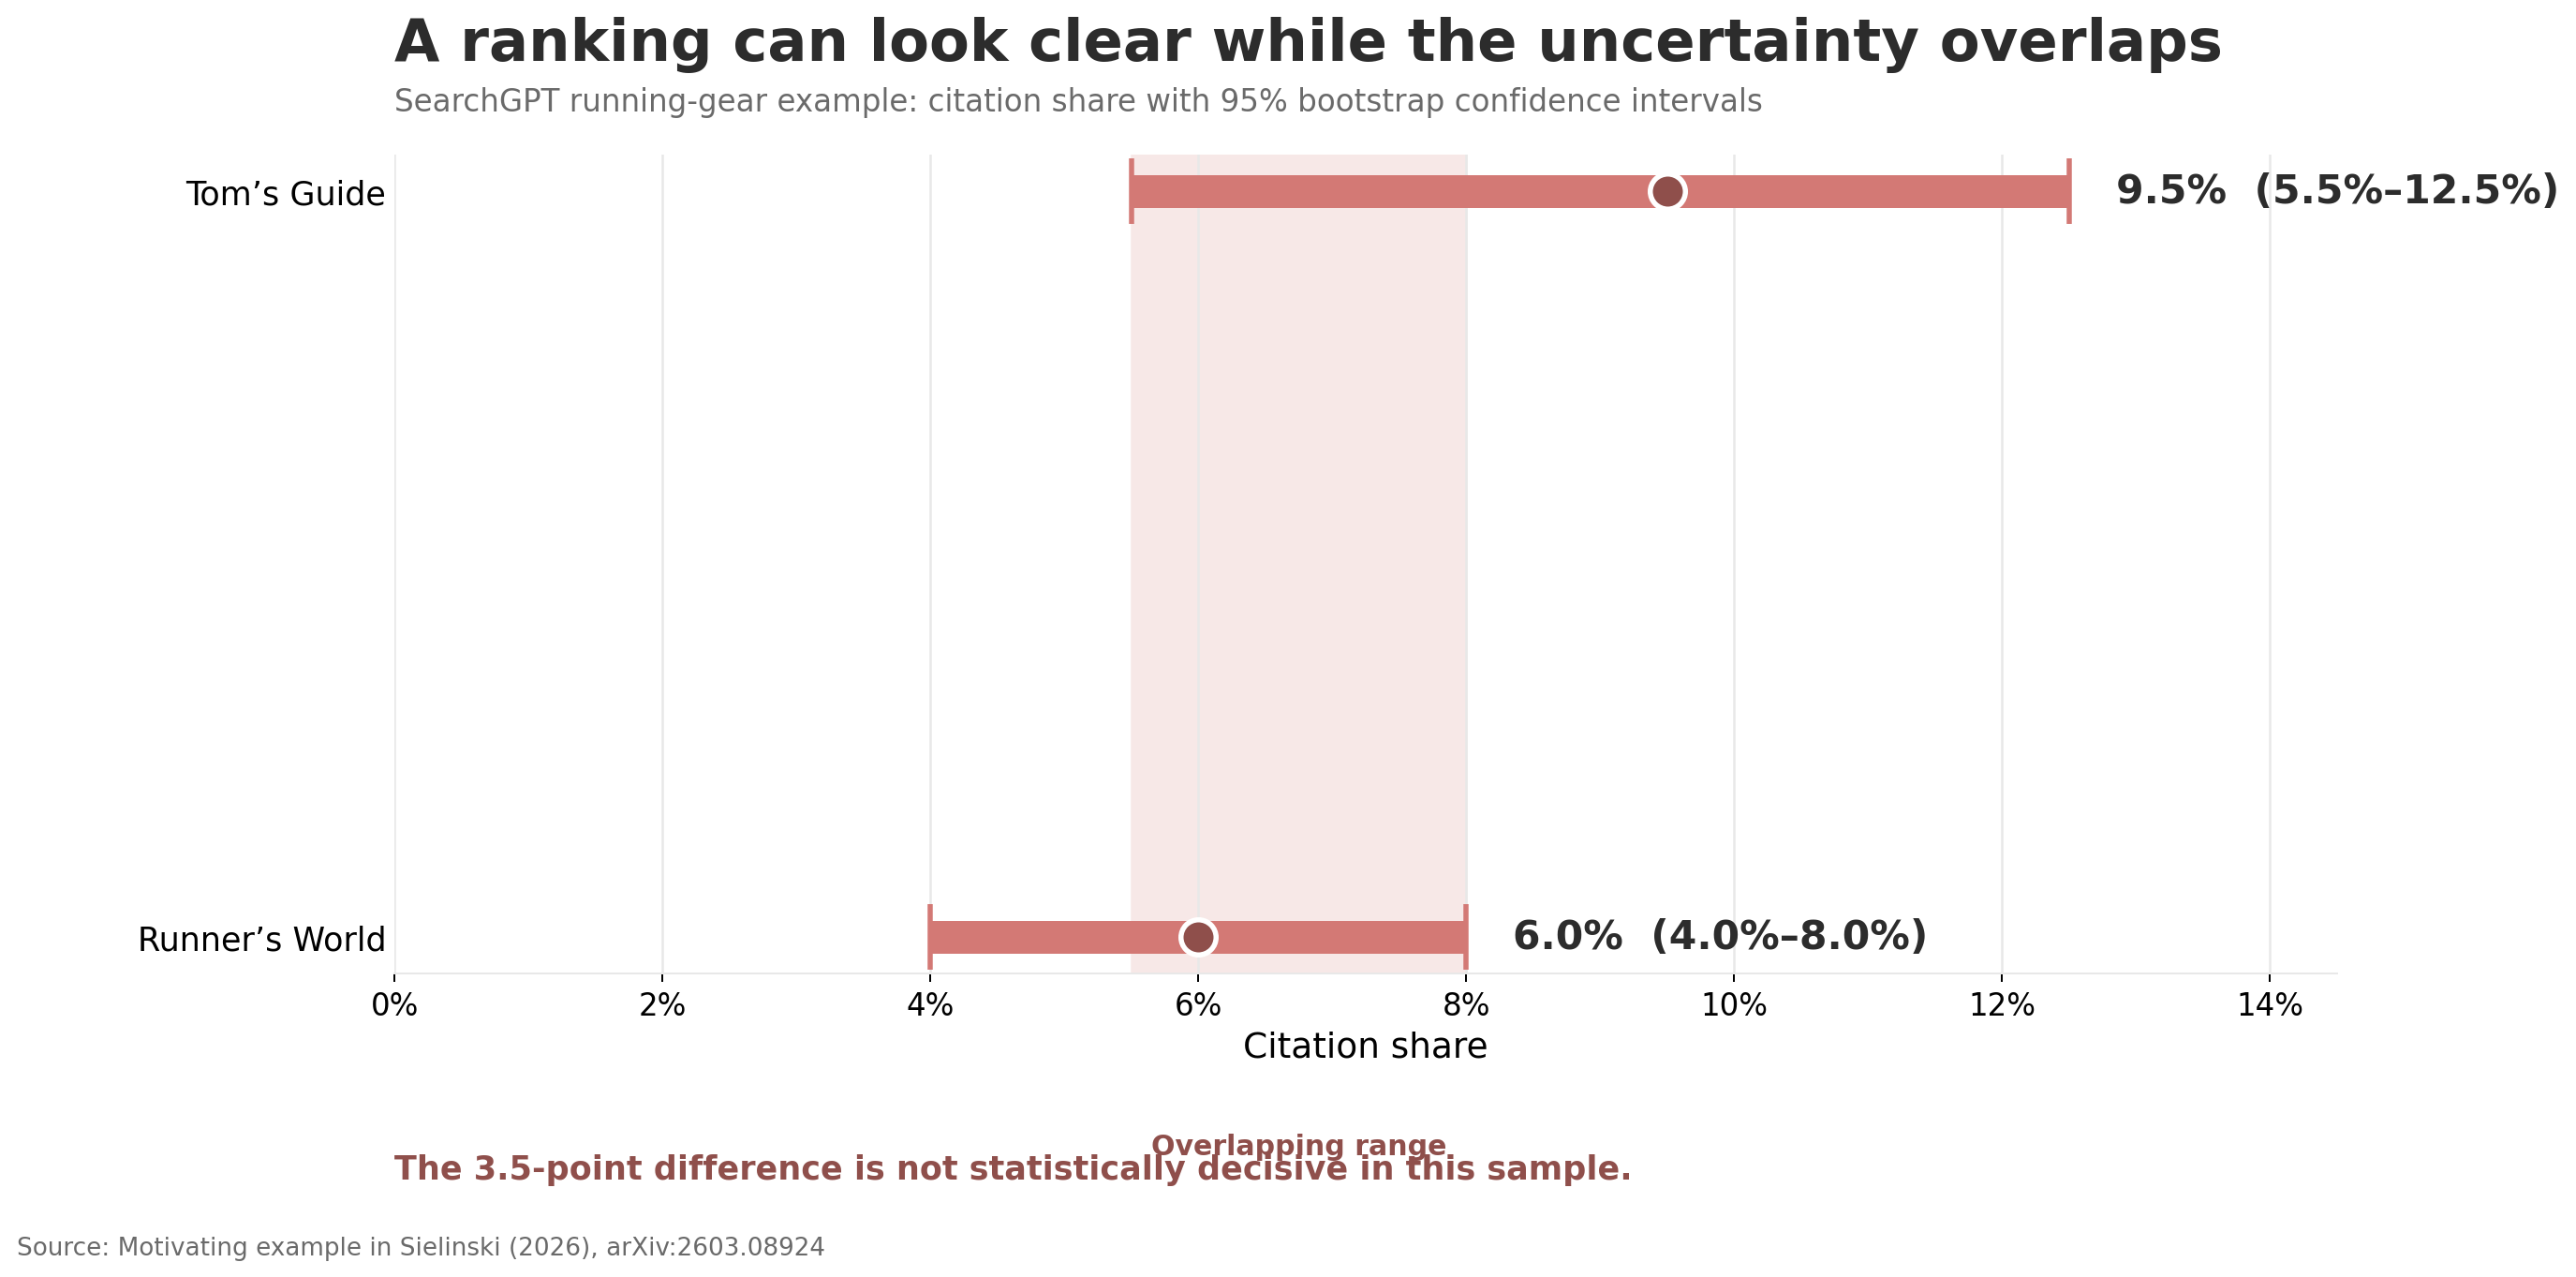
A confidence interval shows the likely range around a measured score.
The paper used response-level bootstrap sampling. Researchers repeatedly resampled the collected responses and recalculated each visibility metric. They used 1,000 bootstrap repetitions to create 95% confidence intervals.
One example involved running gear results from SearchGPT:
- Tom’s Guide had an estimated citation share of about 9.5%.
- Its confidence interval stretched from about 5.5% to 12.5%.
- Runner’s World had an estimated share of about 6%.
- Its interval stretched from about 4% to 8%.
The point estimates suggested a clear winner. However, the ranges overlapped.
That means the reported difference could have come from sampling noise. The study could not confidently claim that one domain performed better.
Across the study, differences below about five to seven percentage points were often hard to separate from noise.
Small GEO Gains May Not Be Real Gains
The findings have a direct effect on generative engine optimization reports.
Suppose a website’s SearchGPT citation share rises from 8% to 11%. A dashboard may describe this as a three-point improvement.
However, the paper found that SearchGPT confidence intervals often spanned three to six percentage points. Therefore, the reported gain may fall inside the normal noise range.
A stronger test should compare:
- Repeated baseline samples
- Repeated samples after the change
- Confidence intervals for both periods
- The size of the difference between them
A content change should not receive full credit unless its effect is larger than the expected measurement noise.
This does not mean GEO work has no value. Instead, it means GEO results need stronger testing.
How Many Queries Are Needed?
The paper explored how sample size changed confidence interval width.
For citation share, it used a target interval width of five percentage points. The observed requirements differed by platform.
| Platform | Approximate queries for citation share |
|---|---|
| Gemini | 40 to 50 |
| Perplexity | About 100 |
| SearchGPT | At least 150 |
The SearchGPT results were less predictable. In some cases, the interval became narrower and then widened as more queries arrived.
For citation prevalence, the study used a target width of 15 percentage points.
| Platform | Approximate queries for citation prevalence |
|---|---|
| SearchGPT | 60 to 80 |
| Perplexity | 100 to 140 |
| Gemini | 140 to 150 |
These numbers are study-specific benchmarks. They should not become universal rules.
The right sample size may change with the topic, query mix, platform, and desired level of precision.
Why Early Stopping Can Create False Confidence
A team may test queries until the confidence interval looks narrow enough. It may then stop collecting data.
The paper warns against this method.
Some confidence intervals became temporarily narrow before growing wider. This happened because the citation distribution shifted across the query sequence.
As a result, stopping at a lucky point could hide the true uncertainty.
A safer plan is to choose the sample size before testing begins. That number should come from earlier measurements of the same platform and topic.
Citation Rankings Were Often Unstable
The study also tested whether full domain rankings stayed in the same order.
It used weighted Spearman rank correlation. The researchers treated a score of 0.9 or higher as a practical stability target.
The results varied sharply:
- Gemini running gear met the stability target in seven of eight usable comparisons.
- Gemini multivitamins met it in only two of eight.
- SearchGPT bird feeders had no stable comparisons among five usable pairs.
- SearchGPT multivitamins and running gear had no comparison pairs with enough precision.
- Perplexity bird feeders and running gear had eight usable pairs each, but none reached the 0.9 target.
Therefore, rank movement was not limited to the leading websites. Uncertainty affected much of the frequently cited domain set.
A brand moving from fourth place to second place may not have gained real ground. The change may reflect normal variation between samples.
Source Page Changes Did Not Explain Most Variability
The researchers also checked whether cited pages changed during the study.
They stored page content and created SHA-256 checksums. Matching checksums showed that the readable page content stayed the same between collection periods.
Most checked transitions showed stable source content. Yet citation shares still moved.
This result supports the paper’s main argument: much of the variation came from answer-engine behavior rather than constant changes to publishers’ pages.
However, the method had limits. Some sites blocked scraping, while videos and PDF files could not always be processed.
A Better AI Visibility Measurement Framework
Marketing teams can apply the research through a clearer process.
Step 1: Define the Metric
Choose citation share, citation prevalence, or both. Avoid comparing raw citation counts across platforms with very different citation volumes.
Step 2: Use a Fixed Query Set
Keep the main query list stable during each comparison. Also record the topic, intent, language, and location settings.
Step 3: Run Repeated Samples
Do not depend on one collection. Test the same queries across several times or days.
Step 4: Store Response-Level Data
Save each response and its citations. Response-level records are needed for proper bootstrap resampling.
Step 5: Calculate Confidence Intervals
Report the point estimate with a 95% confidence interval. For example, write 6%, with an interval from 4% to 8%.
Step 6: Compare Ranges, Not Just Scores
Overlapping ranges do not always prove equality. However, they warn that a simple winner-and-loser claim may lack enough evidence.
Step 7: Set the Sample Size Before Testing
Do not stop only because the latest interval looks narrow. Use a fixed sample target based on earlier platform data.
Step 8: Repeat Before-and-After Tests
When measuring a GEO change, collect repeated samples before and after the update. Then test whether the gain exceeds normal variation.
Step 9: Keep Platform Results Separate
Gemini, Perplexity, and OpenAI search systems have different citation patterns. One measurement plan may not work equally well across all three.
What SEO and GEO Teams Should Report
A useful generative search measurement report should include more than a ranking table.
At minimum, it should show:
- The platform tested
- The full testing period
- The number of queries
- The number of completed responses
- Citation share and prevalence
- A confidence interval for each metric
- The number of repeated samples
- Changes to the query set
- Changes to the tested content
- Limits in the data
Teams should also keep citation visibility separate from citation quality. A domain can receive many citations even when those citations do not fully support the generated claims.
The paper measures how often sources appear. It does not prove that every citation is correct or useful.
Important Limits of the Study
The research offers strong evidence against single-run reporting. Still, its findings have clear limits.
First, it studied only three consumer topics. Results may differ for business, local, news, financial, or navigational searches.
Second, ChatGPT generated the query sets. Real search logs may contain a different mix of questions.
Third, the daily observation period lasted about nine days. It did not capture seasonal changes or major platform updates.
Fourth, the paper does not fully model domains that appear only once or in a small number of samples.
Finally, the preprint contains a reporting inconsistency. Its high-frequency methods and results table include Gemini. However, the limitations section says Gemini was excluded from that experiment because of API rate limits. Readers should treat the exact high-frequency platform coverage with care until the authors clarify it.
Did You Know?
Citation volume differed by about six times across the tested platforms. Gemini produced roughly 40 to 43 citations per response, while SearchGPT produced about six to seven. This gap makes raw citation counts a poor cross-platform comparison metric.
Conclusion
The study changes how marketers should think about AI visibility measurement. Citation share, prevalence, and rankings are not fixed platform properties. They are estimates drawn from changing AI responses.
Therefore, a trustworthy report should use repeated sampling, planned sample sizes, and bootstrap confidence intervals. It should also avoid declaring winners based on small score changes.
The main lesson is simple: measure AI search visibility as a range, not as one perfect-looking number.
FAQs
What is AI visibility measurement?
AI visibility measurement tracks how often a website or brand appears as a cited source in generative search answers. Common measures include citation count, citation share, and citation prevalence. These values should be treated as estimates because answer engines can return different sources across repeated runs.
Why are single-run AI visibility scores unreliable?
One run captures only one possible group of AI responses. The same queries can produce different citations during another run. Therefore, a single score may reflect temporary sampling noise rather than a website’s normal level of visibility.
What confidence interval should an AI visibility report use?
The paper uses 95% bootstrap confidence intervals. This method resamples complete responses and recalculates the visibility metric many times. The final range shows how much the measured citation share or prevalence could vary because of the available sample.
How many queries are needed to measure AI citations?
There is no universal number. In this study, citation-share estimates reached a five-point target width after about 40 to 50 Gemini queries, about 100 Perplexity queries, and at least 150 SearchGPT queries. Other topics may require different sample sizes.
Does the research prove that GEO does not work?
No. The paper does not show that generative engine optimization is ineffective. It shows that measured gains must exceed normal citation variability. Repeated before-and-after testing is needed before a visibility increase can be linked confidently to a content change.